Simuleras, A Simulation Website
Featured ProjectTimeline: May 2026 - August 2026
Project Type: Personal
Python JavaScript AI
Project Description
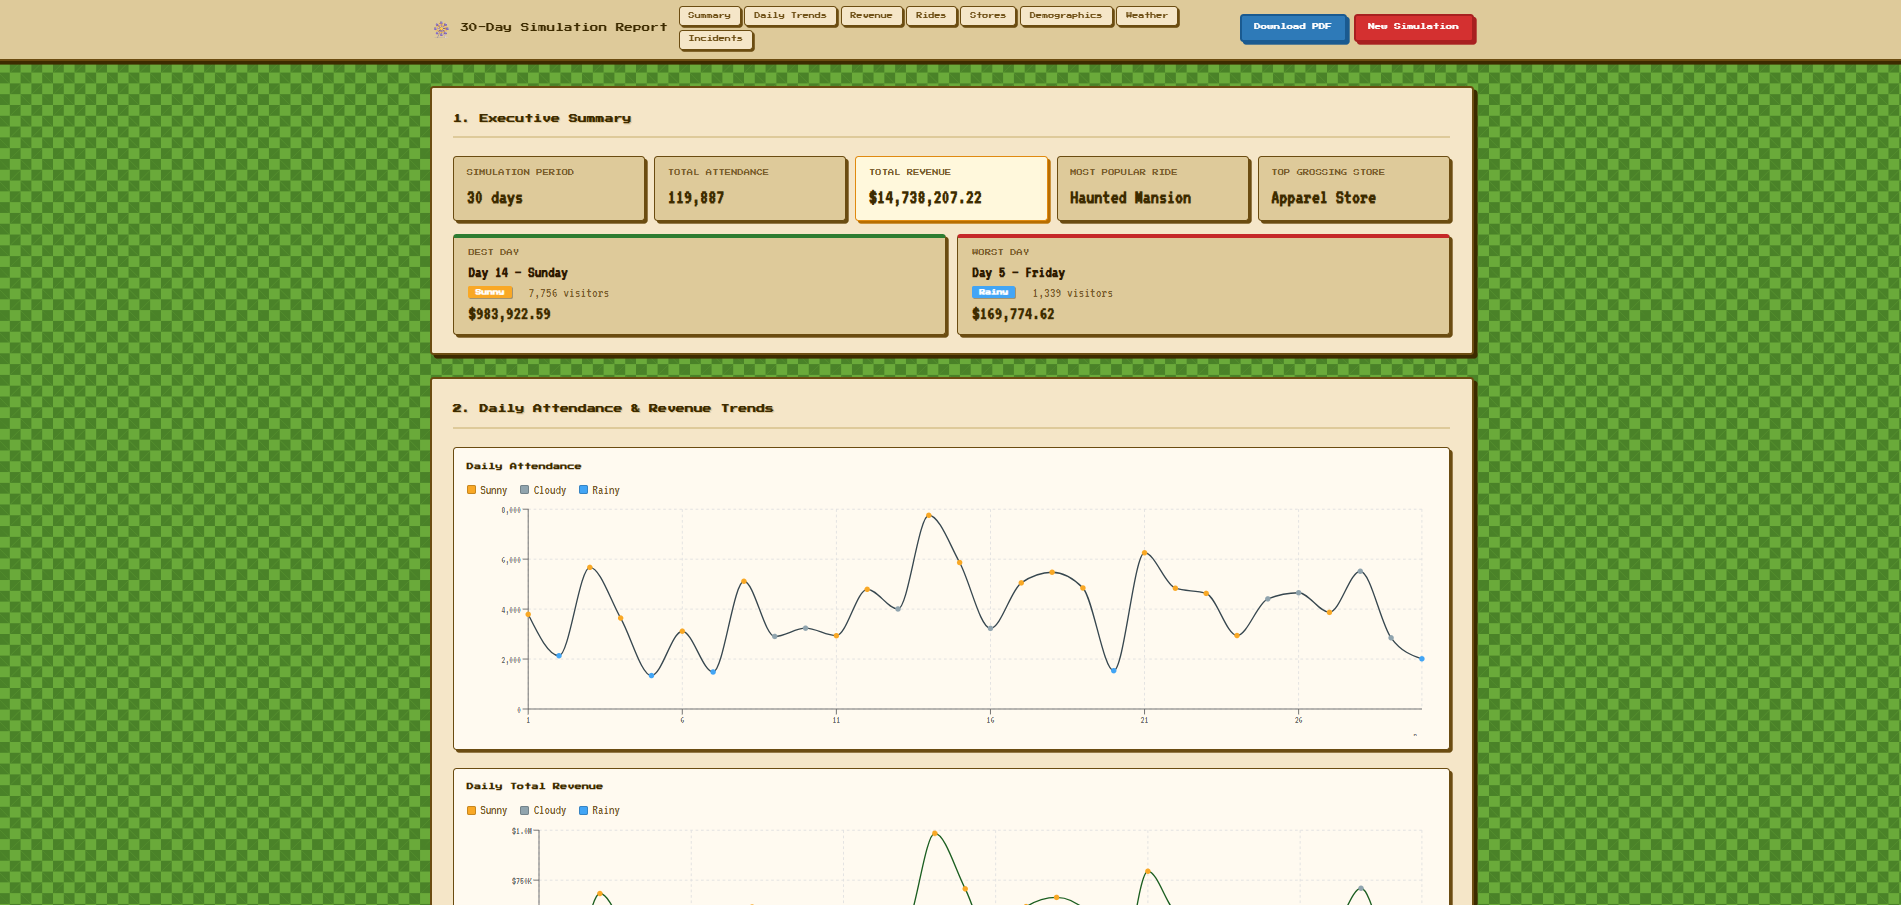
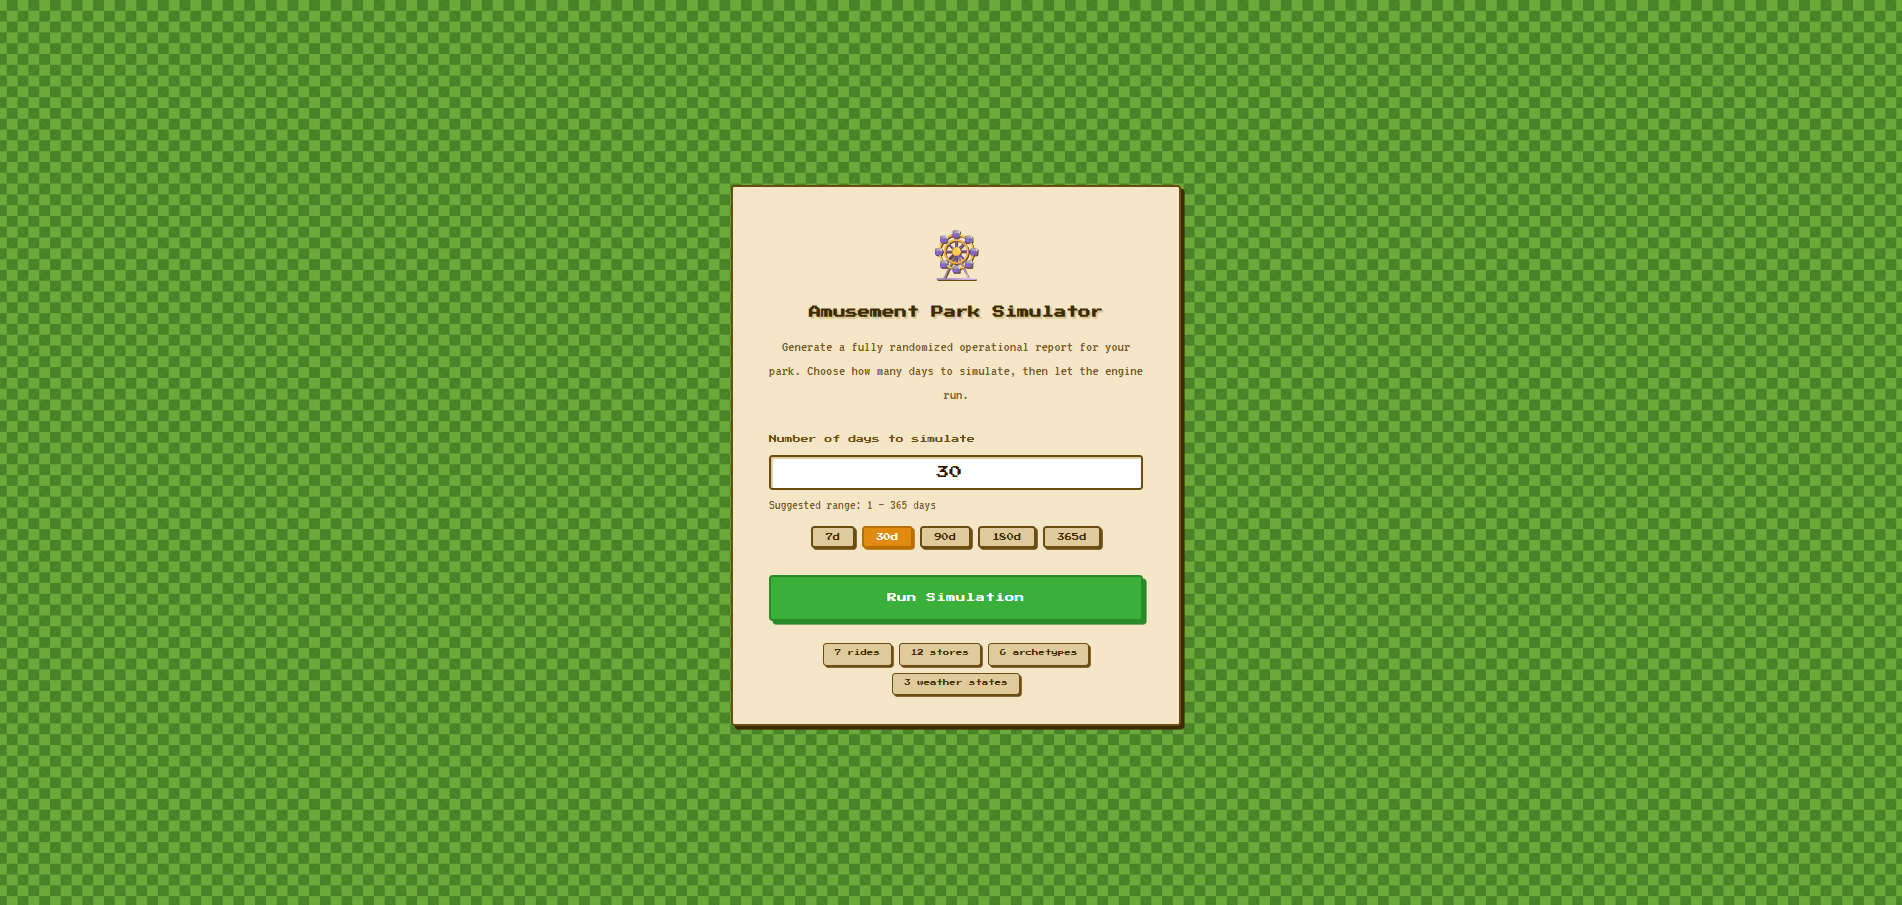
This is a full-stack simulation web application that models the daily operations of an amusement park through a randomly generated, analytics-driven report engine, that generates a PDF analytical report, as well as CSV and SQL files of simulated data. The main goal of this project was to create a PRD (Project Requirements Document) for Claude Code to build and follow the requirements, as well as an application to generate clean data for people to do analytical reports with. The PRD can be seen in the downloads of this project. The system accepts a user-defined simulation period of up to 365 days and models each day with a dynamic weather system, realistic visitor attendance patterns, and six distinct visitor archetypes, families with young kids, thrill seekers, teenage groups, couples, seniors, and school groups, each with unique ride preferences, spending behaviors, arrival windows, and group compositions that drive variation across every simulated day. The park consists of seven themed rides with individual capacity limits, hourly throughput tracking, and random breakdown probabilities that trigger maintenance incidents logged throughout the report, alongside twelve food, beverage, and retail locations each with their own transaction values and service capacities. Revenue is tracked across three streams, ticket sales across four pricing tiers, food and beverage, and retail merchandise, with all simulation logic running entirely in memory through a Python backend with no database attached, meaning every run produces a completely fresh and unique dataset. At the end of each simulation, a fully generated analytical report is rendered in the browser covering executive summary KPIs, day-by-day attendance and revenue trend charts, ride utilization rankings, store performance breakdowns, visitor demographic distributions, weather impact analysis, and a complete incidents log, with the full report available as a downloadable PDF. Built with React and Vite on the frontend, FastAPI on the backend, and Recharts for data visualization, the project demonstrates practical implementation of simulation-based data generation, in-memory ETL aggregation, multi-stream revenue modeling, and full-stack report delivery without any persistent storage layer.
Project Screenshots